A diversity index is a way to measure the prevalence of different species in an ecosystem. I show how methods from the price-index literature can be used to decompose a diversity index into the contribution of each species towards overall diversity.
A diversity index is a way to measure the prevalence of different species in an ecosystem. Although these arise naturally in ecology, diversity indexes show up elsewhere as well. In economics, for example, we can think of diversity as related to the market concentration of firms (species) in an industry (ecosystem). What I want to show here is how we can use some of the machinery from the world of price and quantity indexes to decompose a diversity index into the contribution of each species towards overall diversity.
What is diversity, anyway?
Diversity is a tricky concept to formalize. Up until writing this post, I would have said it was just the number of species in an ecosystem. In his seminal paper, Hill (1973) considers a family diversity indexes that give a measure of the effective number of species in an ecosystem—that is, the number of species that would be present in an ecosystem if all species were equally prevalent. Mathemetically, if there are \(n\) species and the \(i\)-th species appears with probability \(p_{i}\), then the diversity index of order \(\alpha\) is
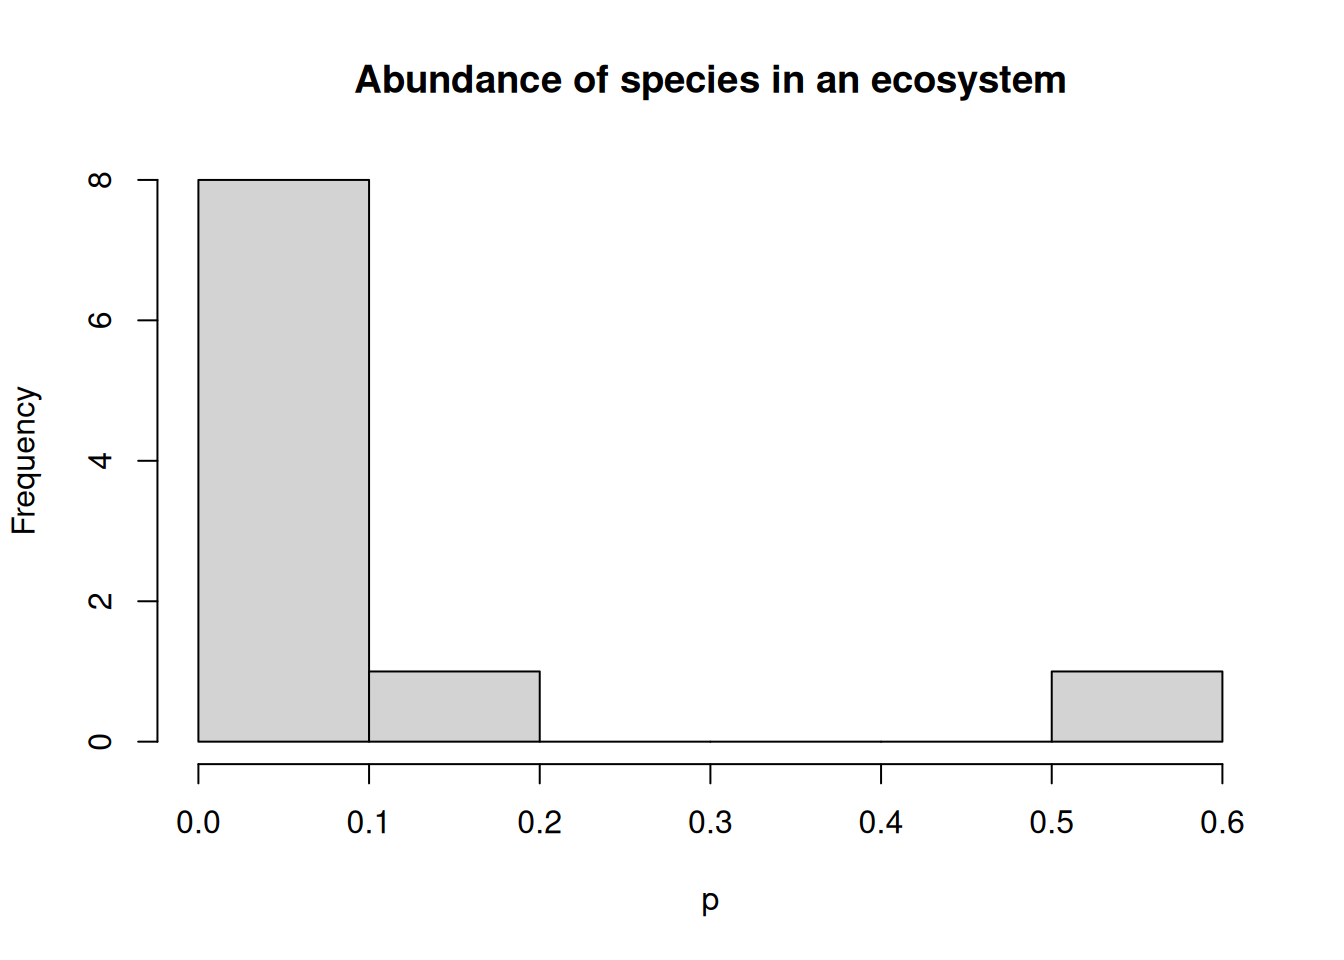
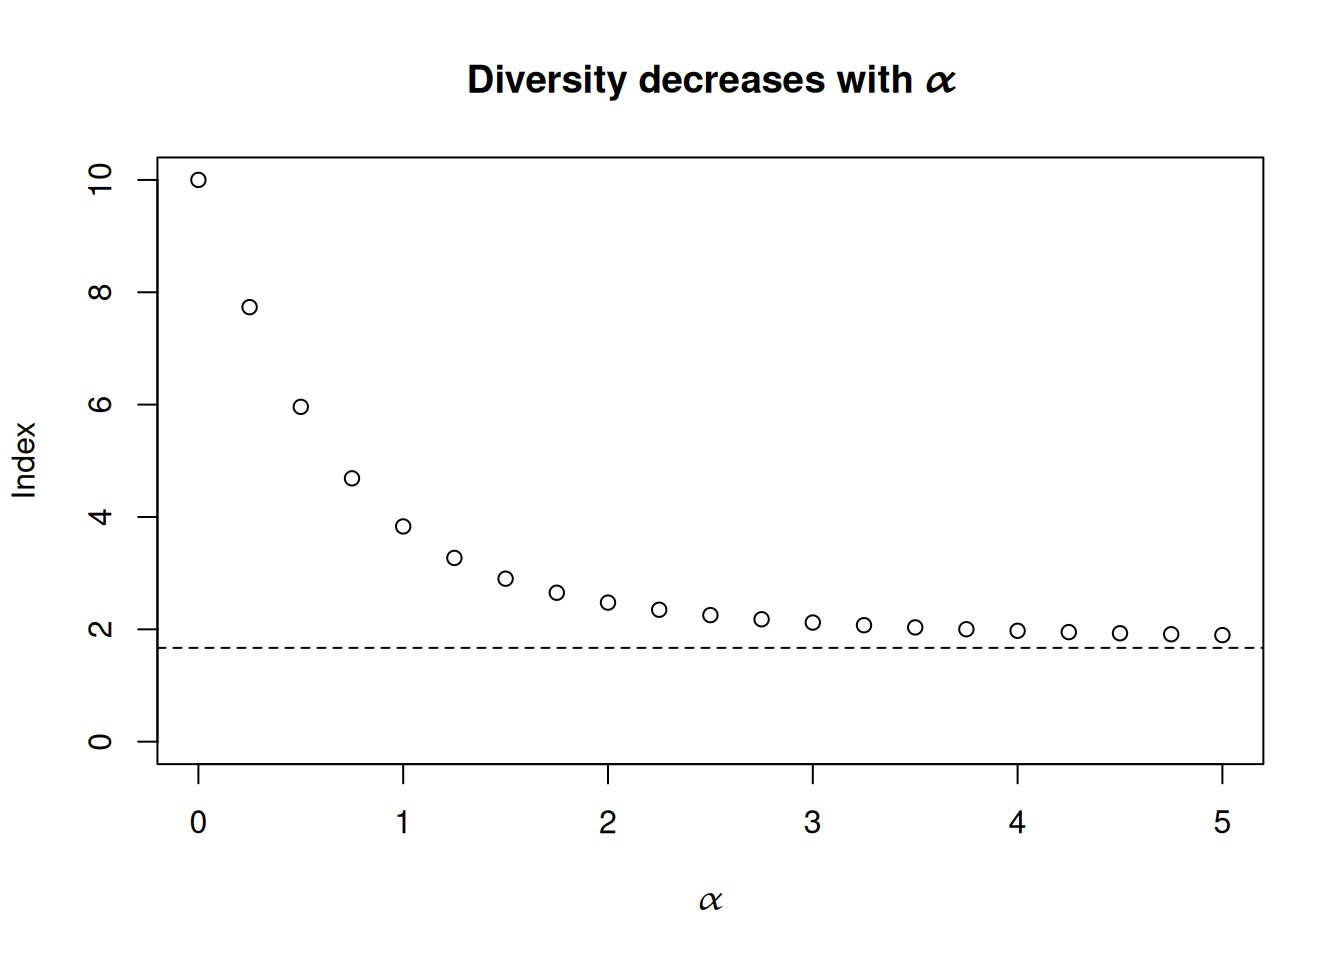
Different values for \(\alpha\) yield different indexes; for example, \(N_{0}\) measures diversity by the total number of species \(n\), also known as the richness of the ecosystem. As a function of \(\alpha\), \(N_{\alpha}\) is a continuously decreasing function that maps values in \([0, \infty)\) onto \([n, 1 / \max(p_{1}, \ldots, p_{n}))\). We can see this with an example of an ecosystem with 10 species.
diversity_index <-function(x, alpha) {if (alpha !=1) {sum(x^alpha)^(1/ (1- alpha)) } else {exp(-sum(p *log(p))) }}set.seed(54321)p <-sort(gpindex::scale_weights(rlnorm(10)))hist(p, main ="Abundance of species in an ecosystem")
With a bit of rearranging, we can see that \(N_\alpha\) is the reciprocal of the generalized mean of \((p_{1}, \ldots, p_{n})\) with these same values as weights
Formulating \(N_{\alpha}\) as a generalized mean shows a clear link between diversity indexes and concentration indexes, as \(N_{2}\) is the reciprocal of the well-known Simpson index (or Herfindahl–Hirschman index if you’re an economist). (It also shows a link with measures of entropy, as \(\log(N_{\alpha})\) is a generalization of Shannon entropy.) What makes a diversity index different from a measure of concentration (or entropy) is that it expresses diversity in terms of the effective size of the ecosystem that would give rise to a particular concentration of species if species were all equally abundant. Intuitively, \(1 / p_{i}\) gives the effective size of the ecosystem if all species were as prevalent as species \(i\). Rather than considering a single species, \(N_{a}\) uses the average abundance across all species to arrive at a measure of diversity.
Decomposing diversity
Hill (1973) notes that different choices for \(\alpha\) imply different sensitivities to rare versus abundant species in an ecosystem. Setting \(\alpha = 0\) means that diversity depends only on the number of species, no matter how rare some may be, whereas when \(\alpha \rightarrow \infty\) then only the most prevalent species influences diversity. We can go one step further by decomposing \(N_{\alpha}\) so that it’s represented as an arithmetic mean of the effective size of each species \(1 / p_{i}\) and we can see the contribution of each species towards total diversity. We’ll do this by borrowing some of the machinery from price and quantity indexes to derive weights \((w_{1}, \ldots, w_{n})\) such that
This gives a different way to view the prevalence of a species, not just by their abundance but by how their abundance contributes towards overall diversity in an ecosystem.
References
Hill, Mark O. 1973. “Diversity and Evenness: A Unifying Notation and Its Consequences.”Ecology 54 (2): 427–32. https://doi.org/10.2307/1934352.